
by Wm. R. Claybaugh II
Introduction
The rocket portion of this flight was fully successful in the specific sense that the rocket motor and airframe worked as expected. For a third time, an inflight payload failure led to separation of the payload at about 5.2 seconds after launch. Following the loss of the payload, the vehicle continued nearly vertically and ultimately impacted less than one mile from the launcher. The payload and nose cone were recovered nearby but separately about 1500 feet from the launcher and about 750 feet to the east of the flight path.
Dual accelerometers (above the motor bulkhead and as part of the payload flight computer) allowed the reconstruction of the flight from 0.4 seconds before liftoff through the 5.2 second mark when the payload separated.
Vehicle Design
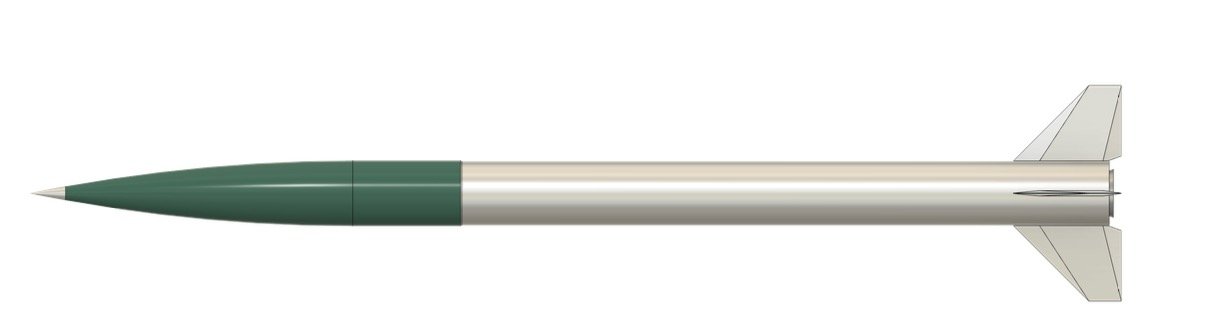
The now standard six-inch rocket made use of a forward bulkhead held by a cylindrical retainer using 24 fasteners. The bulkhead had three ports, one in the bulkhead center for accepting the motor initiator and one to each side, one of these held the forged drogue parachute attachment ring and the other an “Easy Motor” motor pressure sensor and data logger that also recorded vertical acceleration.
The nozzle used a plasma sprayed zirconia coated titanium shell with a superfine isomoulded graphite throat insert. The recovered nozzle showed no signs of excessive heating of the shell (heat paint showed a maximum of 850°F on the outside of the nozzle exit, presumably due to heat soak after motor burnout), indicating that for burn times of up to at least eight seconds the nozzle is fully reusable with the current modified JMAX propellant. Simulation modeling of the internal heat transfer suggests that for this use, the titanium shell is effectively acting as an insulator between the graphite insert and the aluminum airframe structures.
As previously, the solid aluminum fins were bolted through the motor / airframe wall using an internal “fin can” to provide the additional material for countersinking the fin attachment fasteners, which were placed below the nozzle O-ring. Like the bulkhead, the nozzle was retained within the internal “fin can” by a cylindrical aluminum retainer with 20 fasteners; the fins were retained with four fasteners each.
Total modified JMAX propellant mass was 60.95 lbsm; the rocket (less payload) weighed 97.55 lbsm fueled (62.5% propellant). The payload mass was 27.67 lbsm.; total launch mass was 125.2 lbsm.
Flight Performance
Combining the data from both accelerometers allowed reconstruction of the flight vertical (z axis) accelerations from launch through 5.35 seconds. This data set included motor internal pressure data from 0.40 seconds before first motion through the first 2.1 seconds of flight.
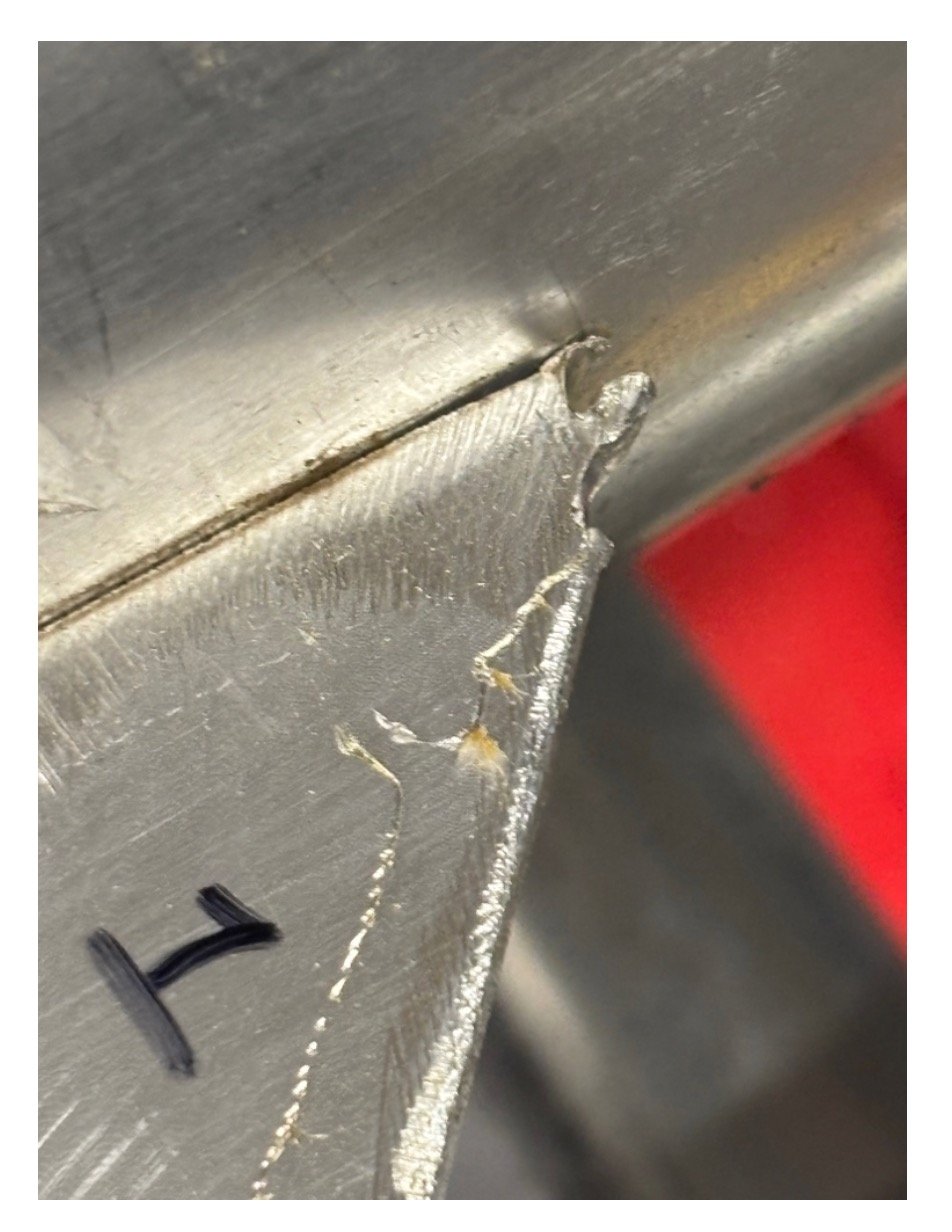
The acceleration data records the fly-away rail guides dragging on the launch tower from about 5.6 feet altitude until clearing the 24-foot launch tower. This dragging was due to a slightly loose lower rail guide that began tearing on one of the fins, ultimately resulting in that fin completely tearing though the 0.021” thick spring steel rail guide vehicle attachment (see fin damage image below).
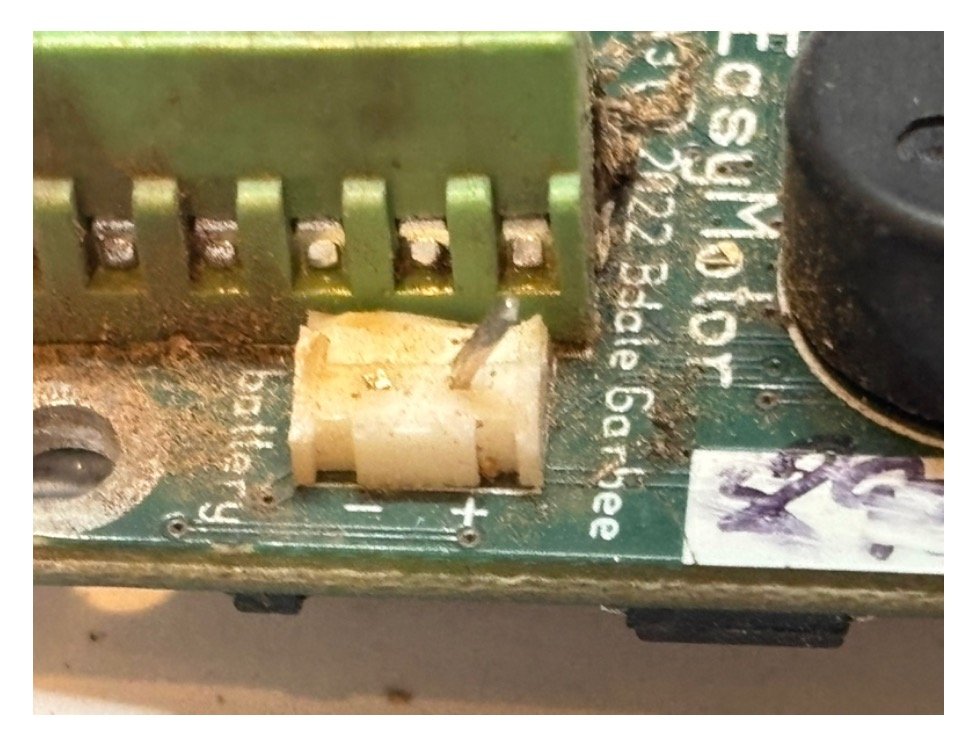
Data recording at the motor pressure logger was lost at 2.1 seconds apparently due to a failure of the connector between the battery and the Easy Motor board resulting in partial loss of the board side of that connector andconsequent loss of power to the data logger. Vertical acceleration was about 13.5 g’s at that time, but the board / connector failure appears to have been vibration related, as the failure did not occur in the vertical plane (see image below).
The vehicle continued accelerating through 5.15 seconds when telemetry signal was lost. At 5.23 seconds the Kate flight computer began onboard recording of a pitch divergence that suggests the payload was separating from the vehicle. That separation occurred at 5.33 seconds at an altitude of 5832 feet and a velocity of 2295 feet / second (Mach 2.0). The final onboard data was recorded at 5.35 seconds at which point the payload is decelerating and losing velocity; final recorded altitude was 5878 feet. Post flight inspection by the manufacturer did not identify any reason for the loss of power to the Kate, which was fully functional save for the missing antenna and some repairable ground hit related damage. Ground observers reported seeing “two pieces” falling from the rocket at this time.
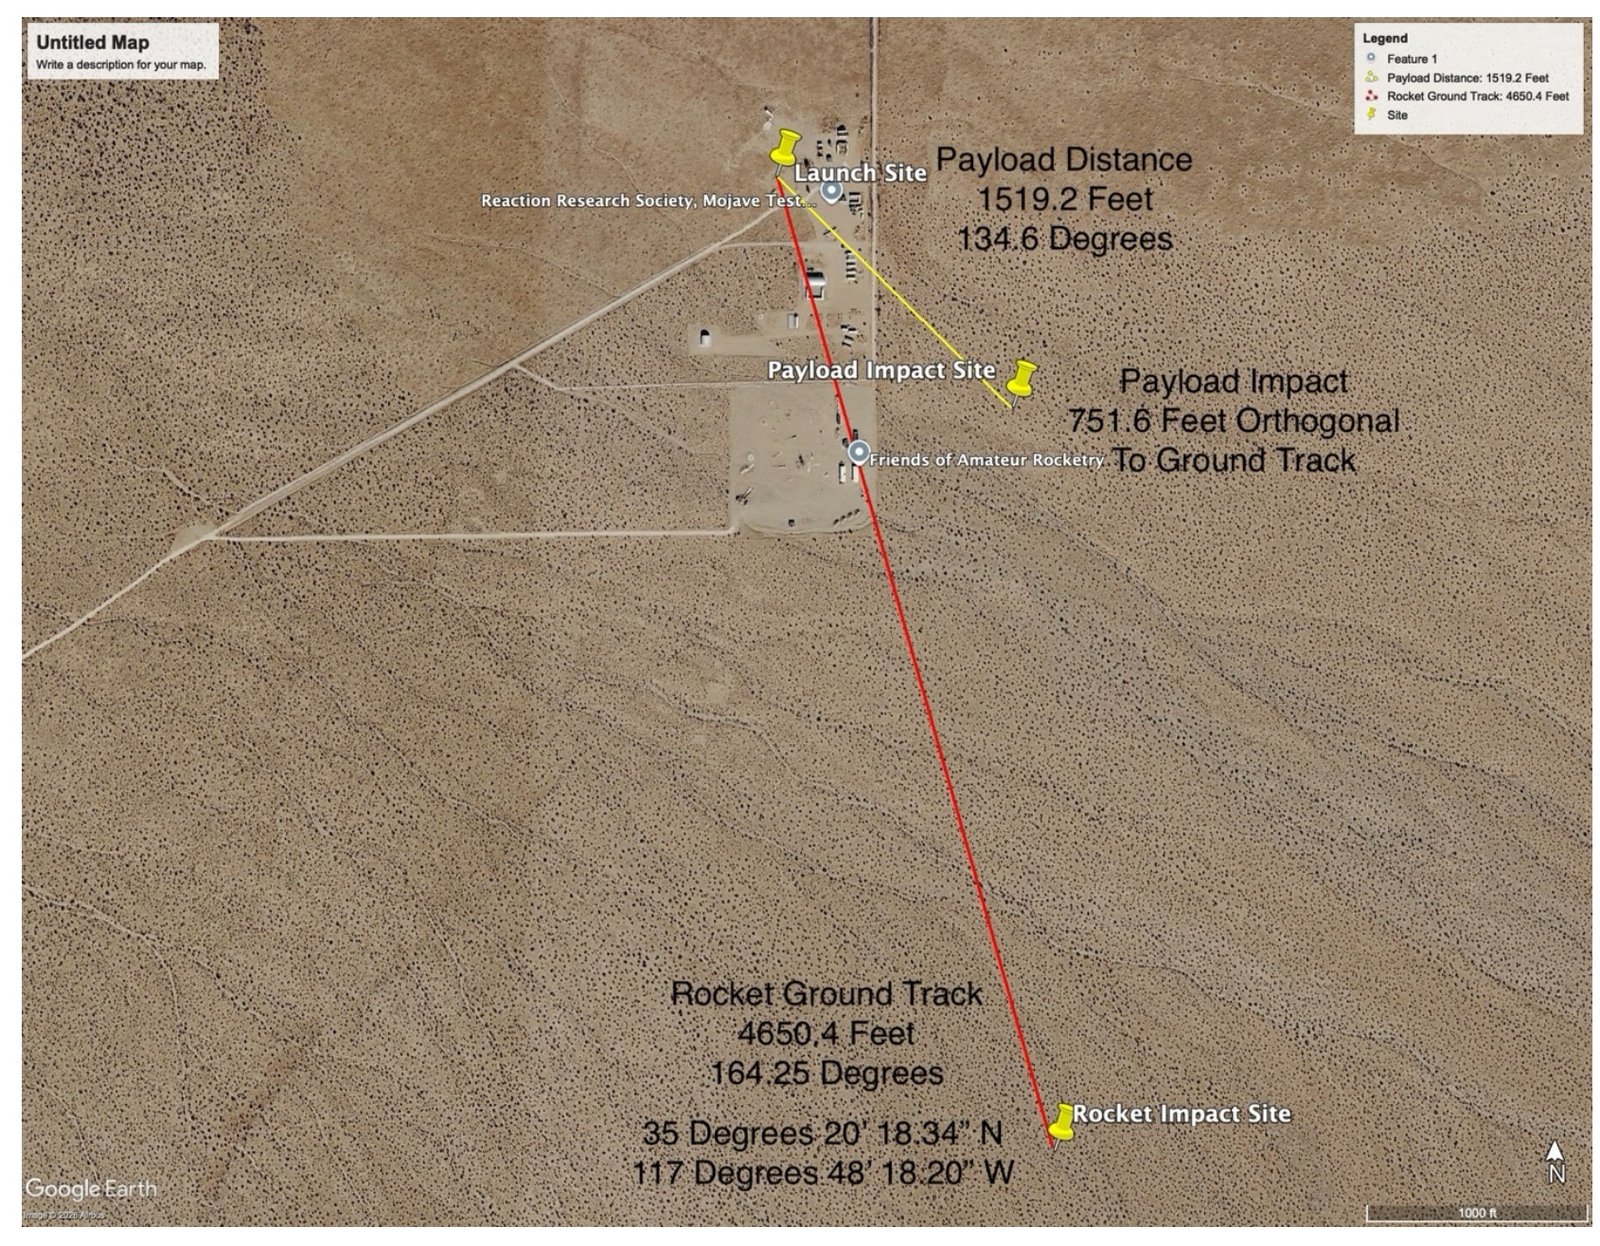
As noted previously, the vehicle continued flying near vertically and remained in the air for nearly one minute before impact was visually observed (a plume of dirt) and heard. Impact was 4650.4 feet from the launch lower on a 164.3 degree bearing.
The payload was recovered in two parts (the nose cone and the main payload assembly) at 1519.2 feet from the launcher on a 134.6 degree bearing. The payload impact was 751.6 feet normal to the rocket flight path (see image below).
Propellant Characterization
The in-flight motor pressure data allows an estimate of the modified JMAX propellant performance albeit with multiple assumptions:
Assuming that the actual burn time was the preflight modeled 8.1 seconds (which is highly consistent with the recorded pressure data) and recognizing that both the modeled and the recorded pressure data indicate a constant pressure burn curve (845.4 psia average, 883 psia maximum and 832.7 psia minimum over 1.79 seconds), we can estimated propellant mass flow as the total propellant mass divided by the burn time, 7.52 lbs. / sec.
Using this initial estimate and noting that the graphite nozzle throat does not erode with this propellant, we can estimate the propellant characteristic velocity (c*) from the pressure data. Given the measured inflight average chamber pressure of 845.4 psia, we calculate c* as averaging 4796 ft. / sec. Note that this estimate includes propellant consumed in thrust build up and tail off (from the mass flow assumptions) and is thus likely slightly lower than the actual value.
Using the accelerometer data, we can estimate thrust as the measured acceleration times the estimated instantaneous mass of the rocket plus the estimated drag. Because the propellant mass flow is close to constant, we can estimate the vehicle weight in flight by multiplying the mass flow rate by the burn time and subtracting that from the initial mass of the vehicle. For drag, we can use a flight simulation model (RASAero II) validated against the known vehicle characteristics and the in-flight data to estimate the drag at each 0.01 second data interval. This exercise results in an estimated in-flight average thrust of 1559.2 lbsf. Note that this average imbeds the thrust increase due to dropping atmospheric pressure in flight and is thus a bit higher than a sea level thrust measurement.
Given this estimate of average thrust over the data interval, we can calculate the thrust coefficient (Cf) as an average of 1.39 and the Specific Impulse (Isp) to average 207.2 seconds in flight and 204.3 seconds after adjusting to sea level exit pressure.
Payload Separation
The in-flight separation of the payload at 5.33 seconds was preceded by loss of telemetry from Kate at 5.15 seconds.
The recovered payload shows the transmitter antenna snapped oN at the top of the internal support structure (see below with intact Kate’s to the left and the recovered flight unit to the right). Assuming the loss of telemetry was caused by the loss of the antenna and noting that there is no evidence of any sudden side acceleration force in the data, it follows that the most likely cause of the antenna failure was the nose cone separating from the vehicle, which was then followed by the payload assembly tearing off the rocket under the consequent high aerodynamic loads.
This is not a new problem: two previous flights have also suNered nose cone separation despite the use of increasingly powerful structural adhesives to bond the Nose Cone to the payload fairing structure. Careful examination of the Nose Cone post flight showed that nearly all the structural adhesive used to bond the Nose Cone to the Payload Fairing was missing, what remained was mostly reduced to a powder. There was no evidence of any tearing or other damage to the fiberglass structure on either side of the joint.
The Kate flight computer recorded atmospheric pressure (as altitude) inside the payload in flight. At launch those values were consistent with the launch site measured 13.7 psia atmospheric pressure, however, as velocity increased, the pressure inside the payload dropped below the estimated atmospheric pressure based on the accelerometer estimated altitude and the US Standard Atmosphere. Ultimately, Kate showed internal pressure in the payload that was 3.3 psia lower than the estimated external atmospheric pressure (7.65 psia vs. 10.96 psia) at the time of loss of data.
Assuming that this drop in internal pressure was due to the Bernoulli Effect operating over the payload vent holes, an analysis of the bond joint under delta pressure was conducted. As with the two previous failures, this analysis concluded that the forces acting on the joint are far smaller than the joint strength, even assuming that strength was just 10% of theoretical.
However, a new analysis treating the payload internal volume as a Helmholtz Resonator induced by the supersonic airflow over the eight 0.25” diameter vent holes indicates a resonance at about 118 hertz. Combined with Poisson axial tension induced by the higher outside pressure, this may—over the 5.2 second flight time—be sufficient to induce low cycle fatigue of the epoxy within the Nose Cone / Payload Fairing joint due to repeated axial loading of that joint; even a 1 psia pressure differential would induce about +/- 30 lbsf of repeated axial loading on the joint.
Because the suspected Helmholtz resonance is at a frequency above the 100 hertz data sampling rate, this conjecture cannot be confirmed based on flight data. However, there does not appear to be any other plausible explanation for the loss of the epoxy within the joint or the assumed subsequent forward separation of the Nose Cone under a measured 14.6 g’s axial acceleration. (This failure mode requires that the nose cone moved forward about three inches after the joint failure to clear the lap joint with the lower payload fairing.)
Conclusions
The in-flight motor pressure data provided by the Easy Motor set-up is extremely useful; that system will be included on all future flights. Hot glue or epoxy potting applied to the power connector joint appears likely to assure that the failure that occurred on this flight will not be repeated.
The Nose Cone must be mechanically attached to the payload fairing in future; countersunk rivets or other fasteners are required to ensure the Nose Cone remains firmly attached to the vehicle. The payload vent holes need to be moved further down the cylindrical section of the payload faring (two to three vehicle diameters from the nose cone is the rule of thumb although that is impractical for this payload since the cylindrical payload fairing is only 1.5 calibers in length). Doing this should reduce the pressure of the air flowing by those vents and thus reduce the intensity of any Helmholtz resonance.
The around one-minute flight time and the less than one mile impact distance suggest a very nearly vertical flight. While no altitude estimate is possible base on the available data, a simulation model of this rocket flying without payload above 5800 feet suggests it could have reached around 50,000 feet altitude given the known conditions on this flight.